Wow this is going to be huge.
I’ve been testing Claude’s new ability to generate complex interactive diagrams on the fly and I’ve been absolutely blown away by what I’ve seen. The future is here without a doubt.
Claude can now visualize literally any concept you can think of in this world.
I asked it to visualize a network request and the results were completely insane — it illustrated everything so easily and effortlessly.
All from a single, dead simple prompt — not even up to 10 words:
visualize how a network request worksAnd the keyword here is interactive — these are not just passive diagrams for you to observe — many of them will actually let you tweak settings and see how various parameters work in your visualization for deeper understanding.
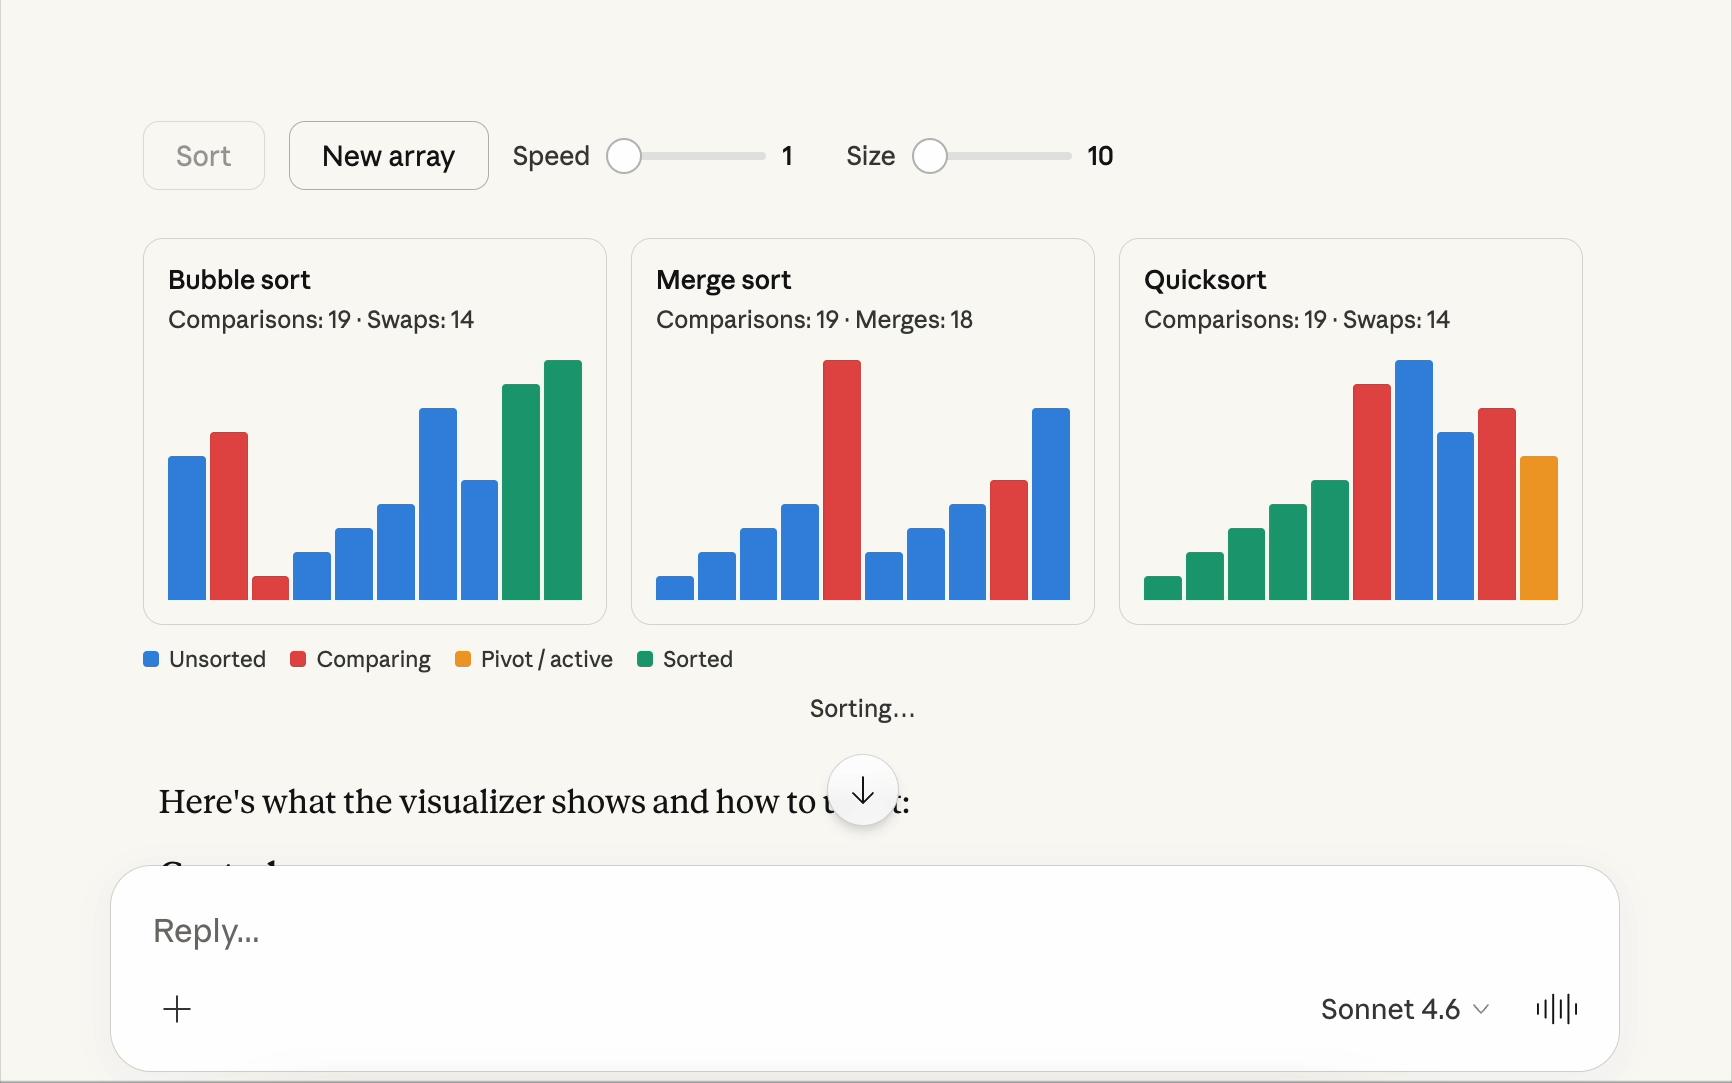
Like this side-by-side sorting algorithm visualization I asked it to do — I was able to adjust options like the array size and the sorting speed.
They’re like mini-apps generated on the fly — we’re definitely heading in this direction right now.
You can even click on them for more details — it will automatically send a new prompt — which will generate a new diagram 👇
You could break down the most intricate systems into their deepest, most fundamental foundational concepts:
In this article I asked it to generate 21 different diagrams — in various aspects of Computer Science and software dev, from system design to AI to networking — and it was unbelievable. It just kept delivering.
Algorithms & data structures
1. Graph traversal (BFS vs DFS)
I asked it to show visually show me the different between breadth-first and
Visualize BFS and DFS traversal on the same graph, showing node visitation order and paths.
2. Sorting algorithm race
Visualize multiple sorting algorithms (quicksort, mergesort, bubblesort) side by side, showing element movements over time.3. Memory layout of data structures
Show stack and heap memory layout with variables, objects, pointers, and references during execution.
4. Hash table collision handling
Visualize hash table collisions using chaining and open addressing, showing how keys are stored and resolved.
System design & architecture
5. Microservices architecture map
Show a microservices system with services, APIs, databases, and message queues, including communication between components.
6. Event-driven architecture flow
Visualize an event-driven system with producers, brokers, and consumers, showing asynchronous message flow.
7. Distributed system with CAP tradeoffs
Visualize a distributed system under network partition, showing how consistency and availability affect data across nodes.
8. Kubernetes cluster anatomy
Show a Kubernetes cluster with nodes, pods, services, and ingress, including their relationships.
Artificial intelligence
9. Transformer architecture (“attention is all you need…”)
Visualize a transformer model with token embeddings, self-attention layers, and multi-head attention connections.
10. Neural network
Show a neural network with forward propagation of inputs and backward propagation of gradients across layers.
Backend & infrastructure
11. Request lifecycle (end-to-end)
Visualize a client request flowing through CDN, load balancer, application server, and database.
12. Database query execution plan
Show a database query execution plan with index scans, joins, and filtering steps.
13. Caching strategy layers
Visualize layered caching with in-memory cache, distributed cache, and CDN showing data retrieval paths.
14. CI / CD pipeline flow
Show a CI/CD pipeline from code commit through build, testing, and deployment stages.
Network & protocols
15. TCP vs UDP communication flow
Visualize TCP and UDP communication flows, including connection setup, transmission, and reliability differences.
16. DNS resolution journey
Show the DNS resolution process from client to resolver, root, TLD, and authoritative servers.
17. WebSocket vs HTTP lifecycle
Visualize HTTP request-response cycles alongside persistent WebSocket communication.
Security & cryptography
18. Public-key encryption flow
Show public-key encryption with key generation, encryption using a public key, and decryption using a private key.
19. OAuth 2.0 authentication flow
Visualize OAuth 2.0 with client, authorization server, and resource server, including token exchange.
20. Zero trust security architecture
Show a zero trust architecture with identity-based access control across system components.
Concurrency & runtime behavior
21. Multithreading & event loop comparison
Visualize multithreading and event loop models, showing task scheduling, execution flow, and blocking behavior.